An accessible PDF version of this report is available here.
Introduction: Farm to School Incubator Grant Program
The California Farm to School Incubator Grant Program supports local and regional farm to school projects that promote nutrition education, sustainable food production and procurement, and high-quality student experiences. The program is housed under the CA Department of Food and Agriculture Office of Farm to Fork (CDFA-F2F). The California Budget Act of 2020 appropriated $10 million from the General Fund to CDFA for the California Farm to School Incubator Grant Program and to establish a Farm to School Working Group to advance farm to school implementation and explore how to create a more resilient and climate-smart food supply in California. The Budget Act of 2021 included a $60 million one-time General Fund allocation to sustain and expand the California Farm to School Incubator Grant Program, with $30 million allocated for fiscal year 2021-22 and $30 million allocated for fiscal year 2022-23. The Budget Act of 2022 included an additional $30 million one-time General Fund allocation to further expand the Grant Program in fiscal year 2022-23. Taken together, California has invested nearly $100 million in Farm to School programming, in addition to ongoing staff support.1 The Budget Act of 2022 also states that up to 12 percent of funds may be used for administrative costs and that half of funds ($30 million) must be made available to Title 1 schools.
Policy Context and Goals
High level project goals for Farm to School [1] Incubator Grants are to cultivate equity, nurture students, build climate resilience, and create scalable and sustainable change. The increased multi-year state funding and policy priorities reflect policy guidance contained in Planting the Seed, Farm to School Roadmap for Success (Farm to School Roadmap). This roadmap was led by CDFA Secretary Karen Ross and First Partner, Jennifer Siebel Newsom and developed in consultation with a robust group of stakeholders, including farm to school practitioners and food system experts. The Farm to School Roadmap outlined for the first time explicit public procurement goals[2] that strategically link the program’s food and nutrition priorities to sustainable farming and climate change resilience strategies. This includes but is not limited to prioritizing farmers who utilize climate smart practices and production systems, small and mid-sized producers, and socially and/or economically disadvantaged farmers and producers.
Overview of Grant Awards
Thus far, CDFA has awarded competitive grants to two cohorts of grantees: (1) Cohort 1: $8,496,000 for 60 projects (projects began June 2021 and must be completed by March 31, 2023); and (2) Cohort 2: $25,500,000 was awarded for 120 projects (projects will begin April 1, 2023 and must be completed by March 31, 2025) (Table 1).
| Table 1 Cohort 1 (2021-23) and Cohort 2 (2023-25) Award Overview | |||||||
| Track 1 | Track 2 | Track 3 | Track 4 | Total | |||
| Cohort 1 (2021-23) | No. of grantees | 46 | 14 | – | – | 60 | |
| Median award | $46,380 | $249,744 | – | – | – | ||
| Average award | $114,929 | $229,233 | – | – | – | ||
| Min. award | $20,000 | $144,268 | – | – | – | ||
| Max. award | $500,000 | $250,000 | – | – | – | ||
| Funding awarded | $5,286,738 | $3,209,262 | – | – | $8,496,000 | ||
| Cohort 2 (2023-25) | No. of grantees | 53 | 11 | 6 | 50 | 120 | |
| Median award | $150,000 | $482,967 | $200,000 | $149,978 | – | ||
| Average award | $243,969 | $414,056 | $198,420 | $136,490 | – | ||
| Min. award | $29,106 | $120,633 | $190,520 | $20,000 | – | ||
| Max. award | $1,000,000 | $488,602 | $200,000 | $150,000 | – | ||
| Funding awarded | $12,930,376 | $4,554,617 | $1,190,519 | $6,824,488 | $25,500,000 | ||
To support system wide and regional level change on both the demand and supply side of the school food market, grants were allocated in two tracks for Cohort 1 and four tracks for Cohort 2. Cohort 1 grant tracks were allocated as K-12 Procurement and Education Grants (Track 1) and Regional Partnership Grants (Track 2). For Cohort 2, in addition to K-12 Procurement and Education Grants (Track 1) and Regional and Statewide Partnership Grants (Track 2), Farm to Early Care and Education Grants (Track 3) and Producer Grants (Track 4) were added to the program.
Overview of Program Demand
Demand for the California Farm to School Incubator Grant Program is consistently increasing across cohorts and tracks. For Tracks 1 and 2, the number of applicants doubled from 80 in Cohort 1 to 160 in Cohort 2. Table 2 provides data on applicants and funding for Cohorts 1 and 2 across all tracks. Demand for the program for Cohort 1 exceeded grant funds by 34 percent on average. For Track 1 of Cohort 1, funds requested were nearly the same as funds available and awarded ($5.8 million vs. $5.2 million). For Track 2 of Cohort 1, funds requested were nearly double the amount of funds available and awarded ($6.1 million vs. $3.2 million).
Demand for the program for Cohort 2 exceeded grant funds by 77 percent on average. For Track 1 of Cohort 2, funds requested were almost twice the amount of funds available and awarded ($20.3 million vs. $12.9 million). For Track 2 of Cohort 2, funds requested were nearly five times the amount of funds available and awarded ($22.4 million vs. $4.5 million). For Track 3 of Cohort 2, funds requested were nearly five times the amount of funds available and awarded ($5.6 million vs. $1.1 million). For Track 4 of Cohort 2, funds requested were nearly one and a half times the amount of funds available and awarded ($9.6 million vs. $6.8 million).
Overall, Cohort 1 had a total requested amount of nearly $12 million by 80 applicants and nearly $8.5 million was awarded to 60 grantees. Cohort 2 had a total requested amount of over $58 million by 264 applicants and nearly $25.5 million was awarded to 120 grantees. CDFA anticipates more demand than funds for Cohort 3 across all tracks.
| Table 2 Demand for Grant Program Exceeds Available Funding | ||||||
| Track 1 | Track 2 | Track 3 | Track 4 | Total | ||
| Cohort 1 (2021-23) | No. of applicants | 50 | 30 | – | – | 80 |
| No. of grants awarded | 46 | 14 | – | – | 60 | |
| Funding requested | $5,829,868 | $6,192,734 | – | – | $12,022,602 | |
| Funding awarded | $5,286,738 | $3,209,262 | – | – | $8,496,000 | |
| Cohort 2 (2023-25) | No. of applicants | 106 | 54 | 34 | 70 | 264 |
| No. of grants awarded | 53 | 11 | 6 | 50 | 120 | |
| Funding requested | $20,328,261 | $22,486,723 | $5,628,174 | $9,613,380 | $58,056,538 | |
| Funding awarded | $12,930,376 | $4,554,617 | $1,190,519 | $6,824,488 | $25,500,000 | |
Overview of Program Expansion by Track
Increased funding has allowed for larger awards, the addition of new tracks of funding, and more expansive investment in the California Farm to School Incubator Grant Program. Between Cohorts 1 and 2, two tracks repeated with slight modifications (Tracks 1 and 2). The number of grantees increased slightly between Cohort 1 and Cohort 2 under Track 1 (46 grantees vs. 53 grantees). Twenty-one of the 53 Track 1 grantees (40%) are repeat awardees (Table 3). Conversely, the number of grantees decreased slightly from between Cohort 1 and Cohort 2 under Track 2 (14 vs. 11) (Table 4). Across both repeated tracks, Cohort 2 received more robust investments, consistent with more funds being made available through the Budget Act of 2021. (See Appendix 1 for more detailed information about repeat grantees across Cohort 1 and Cohort 2).
Increased funding also allowed CDFA-F2F to add two additional tracks of funding in response to stakeholder feedback. Tracks 3 and 4 were new tracks added for Cohort 2 only. New funding tracks allowed for grants designed explicitly for producers with an established relationship with at least one school nutrition services department (Track 4), as well as a new track devoted to early childcare centers and their support organizations (Track 3).
| Table 3 Expansion of Track 1 K-12 Procurement and Education Grants | |||
| Cohort 1 (2021-23) | Cohort 2 (2023-25) | Percent increase | |
| No. of grantees | 46 | 53 | 15% |
| Total funding | $5,286,738 | $ 12,930,376 | 145% |
| Median award | $46,380 | $ 150,000 | 223% |
| Average award | $114,929 | $ 243,969 | 112% |
| Min. award | $20,000 | $ 29,106 | 46% |
| Max. award | $500,000 | $ 1,000,000 | 100% |
| Table 4 Increased Concentration of Track 2 Partnership Grants | |||
| Cohort 1 (2021-23) | Cohort 2 (2023-25) | Percent increase | |
| No. of grantees | 14 | 11 | -21% |
| Total funding | $3,209,262 | $ 4,554,617 | 42% |
| Median award size | $249,744 | $ 482,967 | 93% |
| Average award size | $229,233 | $ 414,056 | 81% |
| Min. award size | $144,268 | $ 120,633 | -16% |
| Max. award size | $250,000 | $ 488,602 | 95% |
Overview of Grant Distribution by County
Increased funding enabled Farm to School Programming to expand across the state and incentivized regional collaboration. Farm to School programs have been adopted and are expanding across California, in both urban and rural areas, small towns and large cities. Cohort 1 of Farm to School grantees represented 29 counties. Cohort 2 of grantees extended the reach of the program to 42 counties. Twenty-three counties have three or more grantees in this group. (See Appendix 2 for detailed information about county distribution of grant awards).
In counties where there are multiple grantees across different tracks, there are more opportunities for collaboration and stakeholder engagement, which is consistent with the Farm to School Roadmap’s longer term regional food system capacity building goals. An example of this includes Ventura County:
- Hueneme School District, Oxnard School District, Oxnard Union High School District, and Rio School District received funds in Track 1 to implement farm to school procurement and education activities in their districts.
- Ventura County Farm to School, a non-profit, received funds in Track 2 to establish a school food hub that will source and deliver crops to participating districts, which include all four districts above as well as Ocean View School District, Santa Paula Unified School District, and Ventura Unified School District.
- Alcantar Organic Farm, Laubacher Farms, Inc., and McGrath Family Farmers Inc. received funds in Track 4 to coordinate with the Ventura County Farm to School food hub and increase farm to school food sales to local districts.
Overview of Grant Distribution by Legislative Districts
The tables in Appendix 3 describe the total awards for Cohort 1 by Assembly District (3.A.)and Senate District (3.C.). Data for Cohort 2 is not yet available. For Cohort 1, 25 Senate Districts and 33 Assembly Districts participated in the Farm to School Incubator Grant Program. This reflects 62.5 percent of all Senate Districts and 41 percent of all Assembly Districts. Forty-eight percent of participating Senate Districts received one award. Twenty percent of participating Senate Districts received two awards. The remaining 32 percent of participating Senate Districts received three or more awards, with a maximum of seven awards being awarded in Senate District 2. For participating Assembly Districts, 61 percent received one award. Twenty-one percent received two awards. The remaining 18 percent of participating Assembly Districts received three or more awards, with the maximum of six awards each going to Assembly District 2 and Assembly District 4.
The maps in Appendix 3 illustrate the scope and breadth of the program by legislative district. Map (3.B.) shows the distribution of awards by State Assembly District for Cohort 1. Map (3.D.) shows the distribution of awards by State Senate District for Cohort 1. Darker shading represents legislative districts with the highest density of investment.
Overview of Supplemental Funding and Repeat Farm to School Grantees
Some of those awarded the Farm to School Incubator Grant in Cohorts 1 and 2 also leveraged financial support from other sources. Additionally, 28 grantees from Cohort 1 are repeat participants in Cohort 2, reflecting the agency’s desire to build capacity and sustainability for Farm to School programs. On average, repeat grantees received at least 50 percent more grant funding in Cohort 2 than they did in Cohort 1. This has allowed those grantees to deepen investments with existing schools and producers, and helped to facilitate the development of new partnerships, as captured in school reports in Appendix 1B. Fourteen of the recipients in Cohort 2 are using supplemental funds from US Department of Agriculture Farm to School Grant funds to further existing state-funded initiatives, totaling $1.1 million over the past three years. Seven grantees have existing partnerships with the Center for Good Food Purchasing to improve their procurement practices and food offerings. (See Appendix 1A for more detailed information about repeat grantees across Cohort 1 and Cohort 2.)
Additional Policy Context for Farm to School Incubator Grant Programming
While the Farm to School Incubator Grant Program is a stand-alone program that has been funded across three budget cycles, it may help to actualize other policy and programmatic goals across the state related to mitigating climate change, increasing food security, and more. These synchronous aspects will continue to be investigated across all cohorts with the goal of capturing impact(s) on students, producers, the economy and the environment, as well as the conditions and facilitators needed for program sustainability.
- The Farm to School Incubator Grant Program could help the state achieve related policy objectives: The California Air Resources Board 2022 Scoping Plan included increasing organic agriculture to twenty percent of all cultivated acres in response to Governor Newsom’s directive to prioritize sustainable land management (Scoping Plan, p. 82). This goal aligns with the Farm to School Roadmap’s goal to leverage school buying power to incentivize agricultural practices that “promote climate resilience and environmental sustainability, including organic systems,” through a market based mechanism of public procurement.[3]
- The Farm to School Incubator Grant Program fills a gap that other state school food investments don’t address: Most recent CA school food investments address the demand side of school food purchasing: kitchen infrastructure, workforce training for school nutrition workers (for scratch cooking kitchens), Universal Meals Program (allocates funds to school nutrition departments), and a School Food Best Practices Incentive Program (offers grants to school nutrition departments). Farm to School Incubator Grants are the only school food investments in CA strategically designed for development of both the demand side via grants to districts and also for the supply chain, including grants to producers, food hubs, and for regional level coordination. This is reflected through Track 4 in Cohort 2, which provides Producer Grants and Track 2 Partnership Grants in Cohorts 1 and 2, which provide grants to producers, food hubs, and farm to school support organizations in addition to K-12 school districts. Most school food programs currently rely on third party distributors that often lack a transparent supply chain procurement model, making it difficult to track which producers schools are purchasing from and challenging for small producers to enter the market.[4] Adopting and prioritizing climate smart agriculture practices as a criteria for producers receiving grants is also aligned and measurable against CDFA’s Office of Environmental Farming and Innovation (OEFI) Climate Smart Agriculture practices.
- Ongoing funding for the Farm to School Incubator Grant Program is synergistic with CDFA-F2F’s permanent regional staffing and regional capacity building goals: CDFA’s Farm to Fork Program is in the process of hiring 16 full time regional staff who will work on the ground in their regions. Eight staff persons will serve as Regional Farm to School Network Leads and eight staff persons will be hired as Regional Producer Engagement Specialists. Staff will be hired and onboarded in early 2023. Informed by learnings from the Incubator Grant Program, staff will support farm to school planning and implementation, provide technical support, facilitate relationships between school districts and producers, provide value chain coordination, peer learning circles and regional network building. According to the Farm to School Roadmap’s goals, the intention is to build regional farm to school hubs that could be leveraged to other food system projects and institutional buyers including hospitals, food banks, community colleges and universities; “creating local food system anchors” that support economic development through local food procurement.
- Pre-conditions for program sustainability for farm to school programming are not yet understood: Creating scalable and sustainable change is a high level policy goal for the farm to school program. Yet, understanding the conditions needed for program sustainability is a gap in peer reviewed literature related to farm to school programming. A goal for the evaluation is to understand and elucidate the pre-conditions and facilitators to sustain farm to school programs, on both the demand and supply side, to help fill this gap in knowledge and to support decision making for determining the best use of resources in future investment cycles.[5]
- Third party evaluation will ensure ongoing investments are evidence based: The third party evaluation will continue to inform the legislature and other key state institutions of the impacts and outcomes of the grants (with a focus on educational, economic, environmental and equity impacts), best practices, facilitators and barriers to success, where future investments should be targeted based on state policy goals, and whether the agency is allocating resources effectively and as intended.
Next Update: Spring 2023
The Farm to School evaluation team plans to have additional data available in Spring 2023.
Footnotes
[1] The 2020-21 budget included $1.5 million General Fund annually for CDFA to establish a Farm to School Grant Program. The 2022-23 budget included $3 million ongoing General Fund to expand the regional California Farm to School Network by adding 16 new positions at CDFA.
[2] Procurement goals in the Farm to School Roadmap are: (1) an initial goal of 25% and secondary goal of 40% of resources should be allocated to producers using verifiable climate smart agriculture practices, and (2) an initial goal of 25% and secondary goal of 40% of resources should be allocated to small or mid-sized producers and socially and/or economically disadvantaged California food producers, including but not limited to BIMPOC, LGBTQ+, women, veteran and Tribal producers. Farm to School Roadmap, p. 33.
[3] This strategy also aligns with the Governor’s Executive Order N-19-19, (3)(b) which orders the Department of General Services to develop and implement sustainable purchasing policies across state agencies, including prioritizing more sustainable food purchases that are consistent with state climate policies.
[4] https://fns-prod.azureedge.us/sites/default/files/resource-files/2019-Farm-to-School-Census.pdf, PDF 38; This is also consistent with the USDA Farm to School Literature Review where consistent challenges for school districts participating in farm to school included: the need to “know” your vendors to get purchase data, the fact that local procurement is mostly via distributors rather than direct-to-consumer, increased cost for local food, and the fact that established supply chains can be easier to navigate. https://fns-prod.azureedge.us/sites/default/files/resource-files/Farm-to-School-LitReview.pdf
[5] For example, a review of literature in other food aid programs reveals that pre-conditions to program sustainability are (1) an ongoing source of resources; (2) good technical and managerial capacity; (3) sustained motivation of participants and partners; (4) linkages to government organizations and/or other entities, as well as gradual transitions from project supported activities. https://www.fantaproject.org/sites/default/files/resources/Exit-Strategies-Synthesis-ExecSummary-Jan2017.pdf; Rogers, B. L., & Coates, J. (2015). Sustaining development: A synthesis of results from a four-country study of sustainability and exit strategies among development food assistance projects. Washington, DC, FHI, 360.
Appendices
Appendix 1. Repeat Farm to School incubator Grant Recipients
A. Repeat Grantees [Received Grants in Cohort 1 (2021-23) and Cohort 2 (2023-25)]
| Awardee Name | Award Amount Cohort 1 (2021-23) | Award Amount Cohort 2 (2023-25) | County | Percentage Change in Award Amounts |
| Alta Public Schools | $20,000 | $149,972 | Los Angeles | 650% |
| EPIC de Cesar Chavez High School | $20,000 | $150,000 | Kern | 650% |
| Fiery Ginger Farm | $249,964 | $150,000 | Yolo | -40% |
| Fresno Unified School District | $500,000 | $733,810 | Fresno | 47% |
| Humboldt County Office of Education | $196,444 | $436,031 | Humboldt | 122% |
| Laurel Tree Charter School | $20,000 | $142,050 | Humboldt | 610% |
| Long Beach Unified School District | $500,000 | $720,020 | Los Angeles | 44% |
| Mt. Diablo Unified School District | $154,631 | $309,939 | Contra Costa | 100% |
| Napa Valley Unified School District | $63,500 | $176,660 | Napa | 178% |
| North Coast Opportunities, Inc. | $250,000 | $200,000 | Lake + Mendocino | -20% |
| Oakland Unified School District | $239,463 | $492,302 | Alameda | 106% |
| Palm Springs Unified School District | $145,981 | $168,259 | Riverside | 15% |
| Pasadena Unified School District | $100,675 | $174,017 | Los Angeles | 73% |
| Rialto Unified School District | $286,857 | $150,000 | San Bernardino | -48% |
| Riverside Unified School District | $346,560 | $270,661 | Riverside | -22% |
| Sacramento City Unified School District | $376,500 | $466,570 | Sacramento | 24% |
| San Diego Unified School District | $500,000 | $1,000,000 | San Diego | 100% |
| San Luis Coastal Unified School District | $22,692 | $150,000 | San Luis Obispo | 561% |
| San Miguel Joint Union School District | $20,000 | $150,000 | San Luis Obispo | 650% |
| Sanzuma | $250,000 | $150,000 | Marin | -40% |
| Shandon Joint Unified School District | $20,000 | $150,000 | San Luis Obispo | 650% |
| Sierra Harvest | $249,995 | $488,580 | Nevada | 95% |
| South Monterey County Joint Union High School District | $20,000.00 | $150,000.00 | Monterey | 650% |
| United States Healthful Food Council, Inc. (aka Eat REAL) | $242,766 | $488,602 | Contra Costa + multiple additional counties | 101% |
| Upland Unified School District | $69,500 | $150,000 | San Bernardino | 116% |
| Ventura County Farm to School Collaborative | $202,856 | $486,827 | Ventura | 140% |
| West Contra Costa Unified School District | $227,054 | $321,430 | Contra Costa | 42% |
| Western Placer Unified School District | $30,753 | $150,000 | Placer | 388% |
B. Cohort 1 Highlights from Repeat Grantees (Data source: Grantee quarterly reporting to CDFA-F2F)
- Laurel Tree Charter School students planted and harvested their own garlic and kale; they tracked local salmon and learned about indigenous cooking methods and customs.
- Long Beach Unified School District funded 34 schools within their district to refurbish school gardens. They also provided local peaches and fresh zucchini (for the first time) to all of their 84 schools throughout the district.
- Students in Mt. Diablo Unified School District were able to grow, harvest and learn how to turn their corn into tortillas. In addition, students used the funds to help with the construction of an adobe ADA compliant outdoor classroom at Riverview Middle School. 621 elementary students visited the outdoor classroom space during the 2021 grant period, and many more students wanted to visit but could not due to the program’s current capacity.
- Oakland Unified School District ran two student Advisory council meetings and had 25 field trips to tour and plant seeds in their central garden. They also launched a high school internship program with 24 high school students.
- Increased capacity from Farm to School funding at Upland Unified School District allowed them to accommodate 1,100 students in garden programming.
Appendix 2. Total Awards and Award Count by State County
A. Total Awards and Award Count by State County Across Cohort 1 and Cohort 2*
| Cohort 1 (2021-23) | Cohort 2 (2023-25) | |||
| County | Total Awarded | Award Count | Total Awarded | Award Count |
| Alameda | $261,797 | 2 | $836,381 | 4 |
| Alpine | – | – | – | – |
| Amador | – | – | – | – |
| Butte | – | – | $244,000 | 2 |
| Calaveras | – | – | $150,000 | 1 |
| Colusa | $51,690 | 1 | – | – |
| Contra Costa | $462,607 | 3 | $1,353,082 | 8 |
| Del Norte | $124,994 | 1 | $200,000 | 1 |
| El Dorado | – | – | – | – |
| Fresno | $1,022,580 | 3 | $944,885 | 3 |
| Glenn | – | – | – | – |
| Humboldt | $361,438 | 4 | $777,473 | 4 |
| Imperial | – | – | – | – |
| Inyo | – | – | – | – |
| Kern | $128,188 | 3 | $150,000 | 1 |
| Kings | – | – | – | – |
| Lake | – | – | $129,979 | 2 |
| Lassen | – | – | $1,350,929 | 10 |
| Los Angeles | $960,317 | 6 | $3,001,068 | 10 |
| Madera | – | – | – | – |
| Marin | $250,000 | 1 | $611,468 | 5 |
| Mariposa | – | – | $68,454 | 1 |
| Mendocino | $250,000 | 1 | $100,000 | 1 |
| Merced | – | – | – | – |
| Modoc | – | – | $ 296,165 | 2 |
| Mono | – | – | – | – |
| Monterey | $168,422 | 3 | $688,448 | 6 |
| Napa | $63,500 | 1 | $176,660 | 1 |
| Nevada | $249,995 | 1 | $488,580 | 1 |
| Orange | $367,127 | 1 | $712,315 | 3 |
| Placer | $114,074 | 2 | $386,378 | 3 |
| Plumas | – | – | $207,963 | 2 |
| Riverside | $492,541 | 2 | $1,322,508 | 7 |
| Sacramento | $459,821 | 2 | $1,588,650 | 7 |
| San Benito | – | – | – | – |
| San Bernardino | $356,357 | 2 | $987,093 | 6 |
| San Diego | $695,000 | 3 | $2,314,495 | 9 |
| San Francisco | – | – | $160,989 | 1 |
| San Joaquin | $20,000 | 1 | $476,457 | 3 |
| San Luis Obispo | $206,960 | 4 | $781,161 | 6 |
| San Mateo | – | – | – | – |
| Santa Barbara | $61,070 | 2 | $75,000 | 1 |
| Santa Clara | – | – | $207,025 | 2 |
| Santa Cruz | – | – | $513,843 | 4 |
| Shasta | – | – | – | – |
| Sierra | – | – | $112,963 | 2 |
| Siskiyou | – | – | $295,498 | 3 |
| Solano | $80,922 | 1 | $308,796 | 3 |
| Sonoma | $20,000 | 1 | $812,459 | 4 |
| Stanislaus | $154,155 | 3 | $246,249 | 3 |
| Sutter | – | – | $44,000 | 1 |
| Tehama | – | – | $40,000 | 1 |
| Trinity | – | – | – | – |
| Tulare | – | – | $150,000 | 1 |
| Tuolumne | $268,457 | 2 | — | – |
| Ventura | $471,142 | 5 | $1,467,367 | 8 |
| Yolo | $352,845 | 3 | $547,720 | 4 |
| Yuba | $20,000 | 1 | $173,500 | 2 |
| TOTAL | $8,496,000 | $25,500,000 | ||
*If a Partnership Grant award involves grantees from multiple counties, this table allocates the total award funds equally across those counties. The award is counted once for each county involved.
B. Map of Award Totals by State County – Cohort 1 (2021-23)*,**
*Darker shading represents counties with the highest density of investments.
**If a Cohort 1 Partnership Grant involves grantees from multiple counties, this map allocates the total award funds equally across those counties.
C. Map of Award Totals by State County – Cohort 2 (2023-25)*,**
*Darker shading represents counties with the highest density of investments.
**If a Cohort 2 Partnership Grant involves grantees from multiple counties, this map allocates the total award funds equally across those counties.
Appendix 3. Total Awards and Award Count by Legislative District
A. Total Awards and Award Count by State Assembly District – Cohort 1 (2021-23)* **
| District | Total Award | Award Count | District | Total Award | Award Count |
| 1 | $249,995 | 1 | 35 | $108,188 | 2 |
| 2 | $756,432 | 6 | 37 | $61,070 | 2 |
| 3 | $20,000 | 1 | 38 | $385,821 | 4 |
| 4 | $778,946 | 6 | 41 | $100,675 | 1 |
| 5 | $30,753 | 1 | 42 | $85,321 | 1 |
| 8 | $791,037 | 4 | 45 | $286,857 | 1 |
| 9 | $49,391 | 2 | 47 | $145,981 | 1 |
| 10 | $376,500 | 1 | 52 | $270,000 | 2 |
| 12 | $250,000 | 1 | 53 | $69,500 | 1 |
| 14 | $492,154 | 3 | 56 | $69,642 | 1 |
| 15 | $154,631 | 1 | 58 | $346,560 | 1 |
| 18 | $239,463 | 1 | 62 | $20,000 | 1 |
| 22 | $124,764 | 2 | 67 | $367,127 | 1 |
| 29 | $87,500 | 2 | 69 | $500,000 | 1 |
| 30 | $62,692 | 3 | 77 | $20,000 | 1 |
| 31 | $500,000 | 1 | 78 | $675,000 | 2 |
| 32 | $20,000 | 1 | |||
| TOTAL | $8,496,000 | 60 |
*Data only includes Cohort 1 as data is not yet available for Cohort 2.
**Location information is based on the mailing address provided by the applicant.
B. Map of Award Totals by State Assembly Districts – Cohort 1 (2021-23)*
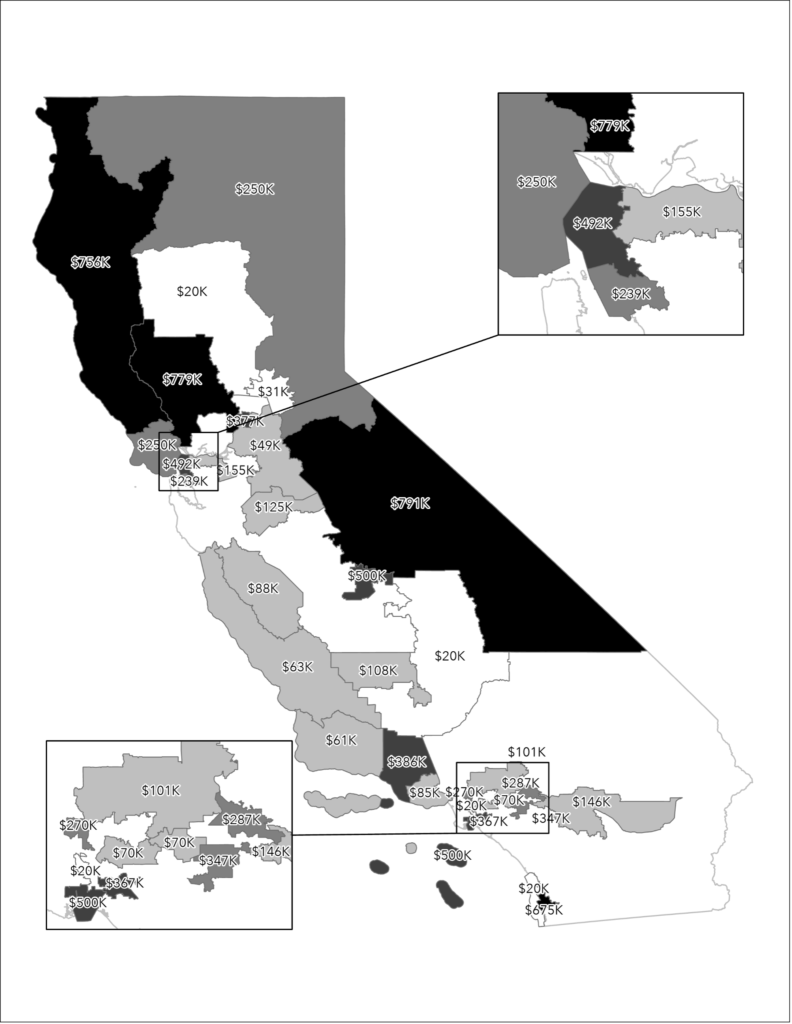
*Darker shading represents counties with the highest density of investments.
C. Total Awards and Award Count by State Senate District – Cohort 1 (2021-23)*,**
| District | Total Award | Award Count | District | Total Award | Award Count |
|---|---|---|---|---|---|
| 1 | $321,685 | 3 | 19 | $145,981 | 1 |
| 2 | $1,006,432 | 7 | 21 | $446,891 | 6 |
| 3 | $727,256 | 5 | 25 | $100,675 | 1 |
| 4 | $422,612 | 5 | 26 | $270,000 | 2 |
| 5 | $20,000 | 1 | 27 | $85,321 | 1 |
| 6 | $30,753 | 1 | 29 | $356,357 | 2 |
| 7 | $731,617 | 4 | 30 | $69,642 | 1 |
| 8 | $376,500 | 1 | 31 | $346,560 | 1 |
| 9 | $154,631 | 1 | 33 | $520,000 | 2 |
| 12 | $542,580 | 3 | 34 | $367,127 | 1 |
| 14 | $500,000 | 1 | 38 | $20,000 | 1 |
| 16 | $108,188 | 2 | 39 | $675,000 | 2 |
| 17 | $150,192 | 5 | |||
| TOTAL | $8,496,000 | 60 |
*Data only includes Cohort 1 as data is not yet available for Cohort 2.
**Location information is based on the mailing address provided by the applicant.
D. Map of Award Totals by State Senate Districts – Cohort 1 (2021-23)*
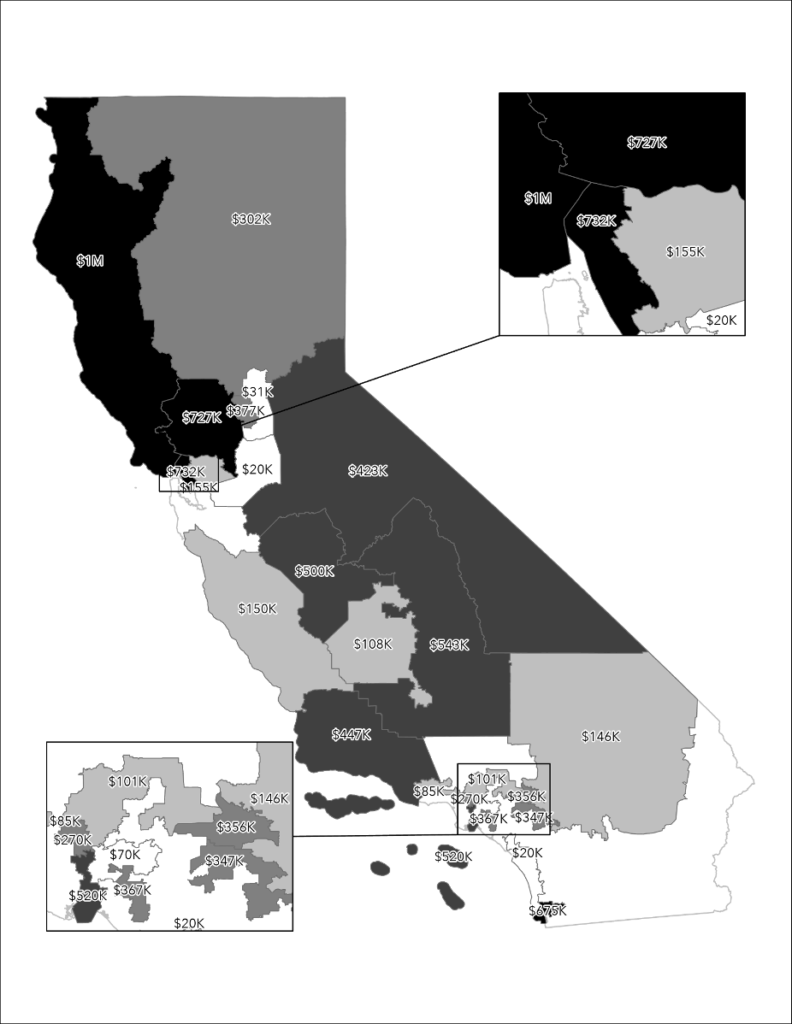
*Darker shading represents legislative districts with the highest density of investments.